

The scheme in chapter 11 for investing in P&C insurers was developed by your authors in the early 2000s and applied (in real time) in early 2011 to buying the shares of Chubb Limited. Here are the details of that analysis and of the subsequent outcomes to the investment. The analysis here is only a sketch. Full details are in the chapter, of course.
Chubb is a large P&C insurer with operations worldwide. It has a wide range of insurance products, including commercial and property, marine, workers’ compensation, environmental, medical, accident, and cyber risk insurance. The company also offers reinsurance and some life insurance.
At the time, Chubb was trading at $58 per share and a market capitalization of $17,242 million. The task is to challenge that price.
Reformulated Financial Statements
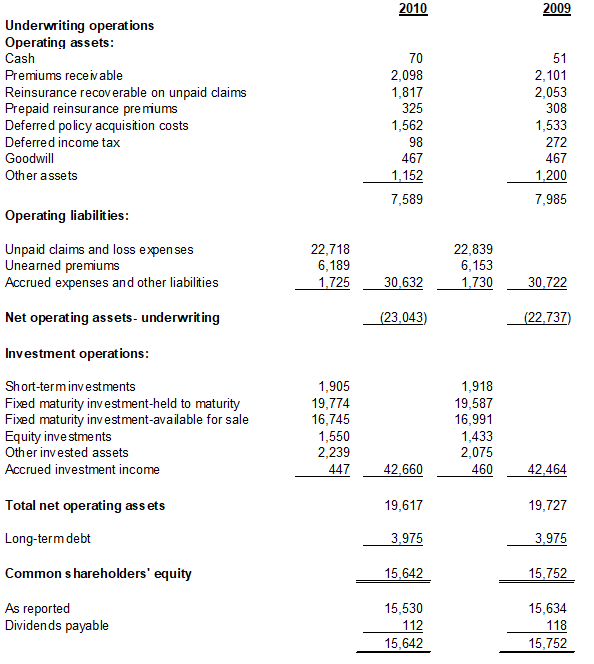
As usual, the investigation starts with reformulated financial statements. These statements not only separate operating activities from financing activities but also investment (operating) activities from insurance (operating) activities:
Chubb Corp.
Reformulated Balance Sheet, December 31, 2010 ($ millions)
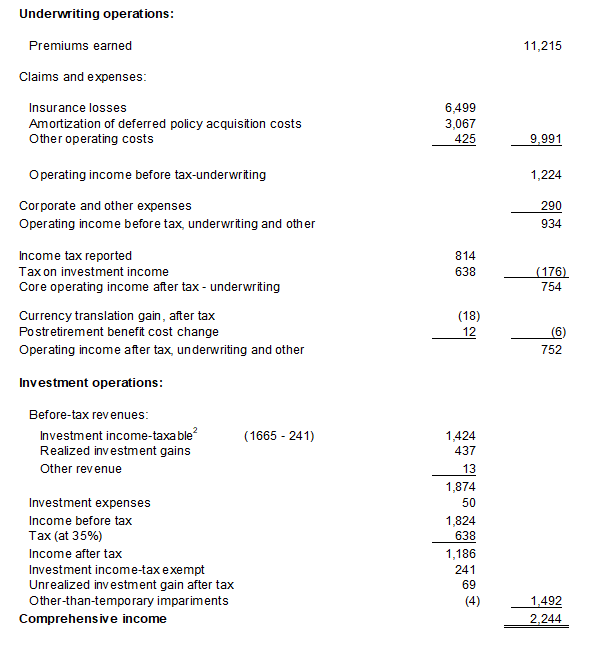
Reformulated Income Statement, Year Ended December 31, 2010
The Market’s Pricing
Now ask what price the market is placing on these activities. The price of the insurance operations is a particular focus and that is given by a plug to the total market capitalization:
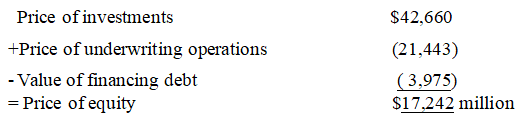
If one accepts the fair value number of investments in the balance sheet (check it!), the number to challenge is the -$21,443 million for the underwriting operation. That is done with reverse engineering to understand the market’s growth pricing. With a calculation of forward residual income from the insurance operation of $1,864 million based on historical average loss and expense ratios,
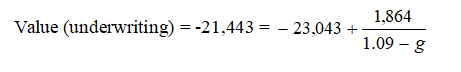
(Yes, you’ll have to go to chapter 11 to see where the $1,864 million comes from.) The solution for g is less than 1.0, that is, the market sees a negative growth rate; the market sees future prospects as lower than current value added. That could be from a combined loss and expense ratio higher than Chubb’s historical average of 93.4%. Or the market sees a decline in the float. Or it sees investments as overpriced. These are the issues to deal with.
Dealing with those issues involves an understanding of Chubb’s business. Is there a reasonable scenario that would justify a negative growth rate in value added? At the time, that seemed very unlikely so the informed investor would BUY.
By the end of 2024, the shares traded at $273 with a dividend per share of $3.64. The BUY at $58 per share would have paid off handsomely.
Postscript:
In 2024, Berkshire Hathaway took a position in Chubb.
